Press Release
Water supply distribution rate in rural areas will significantly increase
- Date:
- 2010-05-26
- View:
- 10,966
Water Supply Distribution Rate in Rural Areas will Significantly Increase
In an attempt to considerably raise water supply distribution rate in farming and fishing villages and islands, the Ministry of Environment plans to carry out an amended water supply policy.
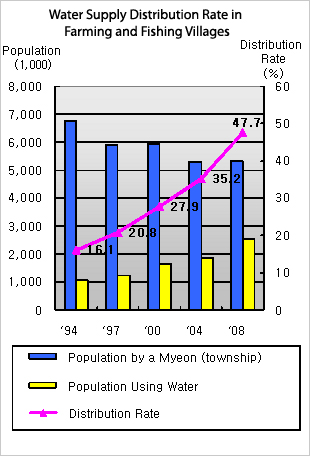
Water supply policy for farming and fishing villages and islands has been implemented through two stages since 1994. As a result of investing 1,684.5billion won in expanding water supply facilities in 539 regions from 1994 to 2009, water supply distribution rate in the rural areas had been raised from 16.1% in 1994 to 47.7% in 2008.
However, the increased distribution rate, 47.7%, is still far below the national average, 92.7%, meaning the fact that more than half of residents in the rural areas are not sufficiently supplied with waterworks. In order to relieve inconvenience they felt by insufficient water especially during drought in spring, there has been necessity for considerably expanding water supply in the region.
Thus, the Ministry of Environment amended the previous water supply policy for rural areas as follows:
1. Raise the target of water supply distribution rate from 75% to 76% until 2014
2. Raise the number of region which will be supplied with waterworks from 196 regions to 503 regions
3. Raise the amount of investment from 1,482.7billion won to 2,451.0billion won
The Ministry of Environment expects around 1,140,000 residents will be newly supplied with running water after the amended water supply policy is implemented.
Yearly Status of Water Supply Distribution
|
2002 |
2003 |
2004 |
2005 |
2006 |
2007 |
2008 | |
|
Total Population(1,000) |
48,518 |
48,824 |
49,053 |
49,268 |
49,599 |
50,034 |
50,394 |
|
Population Using Water(1,000) |
43,021 |
43,633 |
44,187 |
44,671 |
45,270 |
46,057 |
46,733 |
|
Distribution Rate (%) |
88.7 |
89.4 |
90.1 |
90.7 |
91.3 |
92.1 |
92.7 |
|
Amount of Water Supplied Per Capita Per Day(L) |
349 |
347 |
353 |
351 |
346 |
340 |
337 |
Current Status of Water Supply Distribution by Region
|
Total Population (1,000) |
Population Using Water (1,000) |
Distribution Rate (%) |
Capacity of Facility (1,000㎥/day) |
Amount of Water Supplied Per Capita Per Day(L) | |
|
Whole Nation |
50,394 |
46,733 |
92.7 |
28,332 (30,571) |
337 |
|
Seoul |
10,456 |
10,456 |
100.0 |
5,100 (5,100) |
311 |
|
Pusan |
3,596 |
3,587 |
99.8 |
2,443 (2,643) |
295 |
|
Daegu |
2,513 |
2,506 |
99.7 |
1,550 (1,750) |
323 |
|
Incheon |
2,741 |
2,678 |
97.7 |
2,073 (2,073) |
355 |
|
Gwangju |
1,435 |
1,406 |
98.0 |
760 (760) |
321 |
|
Daejeon |
1,494 |
1,486 |
99.4 |
1,260 (1,350) |
334 |
|
Ulsan |
1,127 |
1,075 |
95.4 |
550 (550) |
305 |
|
Gyeonggi-do |
11,549 |
10,906 |
94.4 |
2,646 (2,671) |
319 |
|
Gangwon-do |
1,521 |
1,300 |
85.5 |
780 (788) |
448 |
|
Chungcheongbuk-do |
1,542 |
1,291 |
83.7 |
342 (342) |
371 |
|
Chungcheongnam-do |
2,054 |
1,425 |
69.4 |
165 (165) |
362 |
|
Jeollabuk-do |
1,875 |
1,643 |
87.7 |
186 (246) |
429 |
|
Jeollanam-do |
1,939 |
1,363 |
70.3 |
750 (750) |
359 |
|
Gyeongsangbuk-do |
2,709 |
2,230 |
82.3 |
980 (1,131) |
438 |
|
Gyeongsangnam-do |
3,277 |
2,815 |
85.9 |
1,307 (1,307) |
357 |
|
Jejudo |
566 |
566 |
100.0 |
425 (425) |
337 |
|
Korea Water Resources Corporation |
- |
- |
- |
7,015 (8,521) |
- |

- Prev
- Next